Flamegraph presentation
Flamegraph presentation is a kind of presentation, initially developed by Brendan Gregg, lead performance engineer at cloud provider Joyent. This kind of presentation is especially useful for performance analysis.
A flamegraph is composed of multiple stacks of vertical bars, with each row of bars representing a slice of time, the rows on the bottom being the oldest and the ones on the top of the graph being the newest. Each row might have multiple bars, with each bar representing a different function, and the length of each bar representing the percentage of resources that the function is using at that time.
For a flame graph representing CPU usage, the top bars show what software functions were being executed at the time the data was captured, and the lower bars represent te stack of functions that called the function being captured.
Use of flamegraph representations
Flamegraph representations are used for CPU consumption analysis, especially for V7 style X3 code and for Classic page code. When the X3 engine is started in log mode, an interruption is generated on a regular basis, and on every tick, the stack of the function is stored in a log. By sampling the function called, we have the ability to have a good idea on where the time is spent.
It is important to note that an instruction that accesses to the database or that waits for a client input (in classic page mode) will be considered in execution for the time necessary to get an answer (so in this case the CPU consumption is not relevant).
The page that contains a flamegraph can be reached from a link in the session administration pages (Version 7 style sessions or classic sessions).
A flamegraph looks as follows:
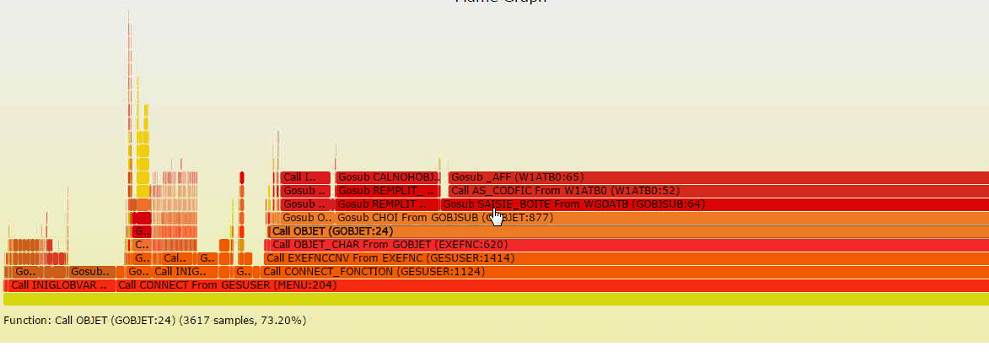
By bringing the mouse pointer over the corresponding bar, the complete definition of the function appears on the bottom line, followed by the number of samples and the estimated time spent.