Statistics
Statistics are pages associated with the setup of statistics calculations. These pages can be present in home pages or in a page called from a menu item.
The detail of the options available when creating a menu item that refers to a statistic can be found in the supervisor statistical tool description documentation.
Statistics page layout
When displaying this page, the results look similar to the following screen:
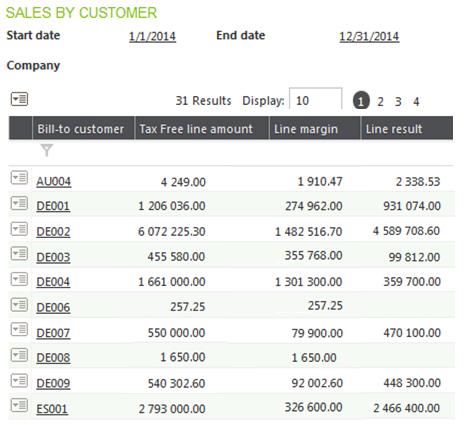
Header options
The information on the header is considered as advanced fields:
- The start and end date (on one or two periods depending on the statistics type).
- The company and site when applicable.
Clicking the start date link displays the statistic for the previous period; clicking the end date displays the statistic for the next period.
The header only displays when the show advanced field link is activated. It corresponds to the first icon on the list of icons that are present on these pages:

On the header, a menu provides access to two links:
- Show graph / Show list (alternatively) that switches from graphical mode to list mode only if mode is displayed at once (this can be changed by the landing page personalization).
- Powerpoint allows you to connect to Powerpoint and create a graph.
The graph displays as the example provided below:
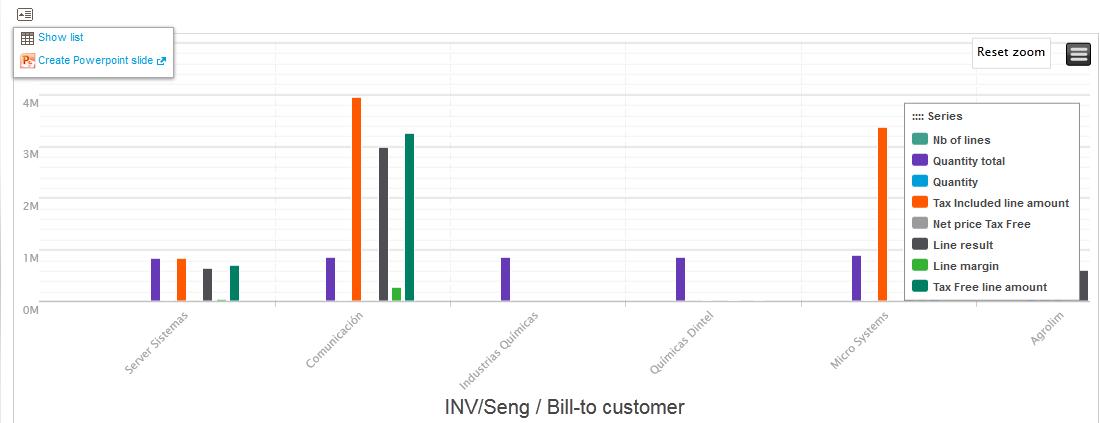
In this graph, you can restrict the display to only some values by using the mouse to select the corresponding square (the zoom is automatically done). You can also enable and disable the display of series by clicking the rectangle before the name of the series.
The UI personalization for this component is described in the UI Home page documentation.
Line options
On the lines, the links Higher level / Lower level can be present. They allow you to navigate in different levels of aggregation for the statistics.