Appendix
Appendix 1: How to determine the Production Scheduler version
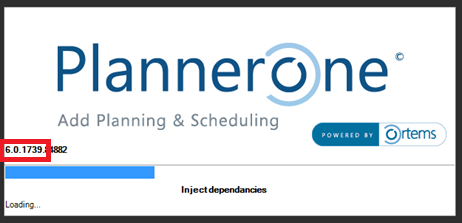
There are various ways to determine the version of Production Scheduler.
- On the Production Scheduler (PlannerOne) manager startup splash screen.
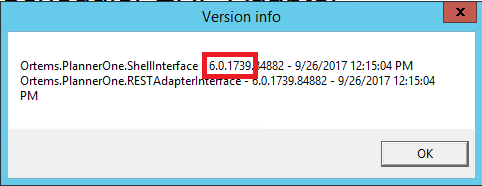
- From the Production Scheduler manager Summary tab.
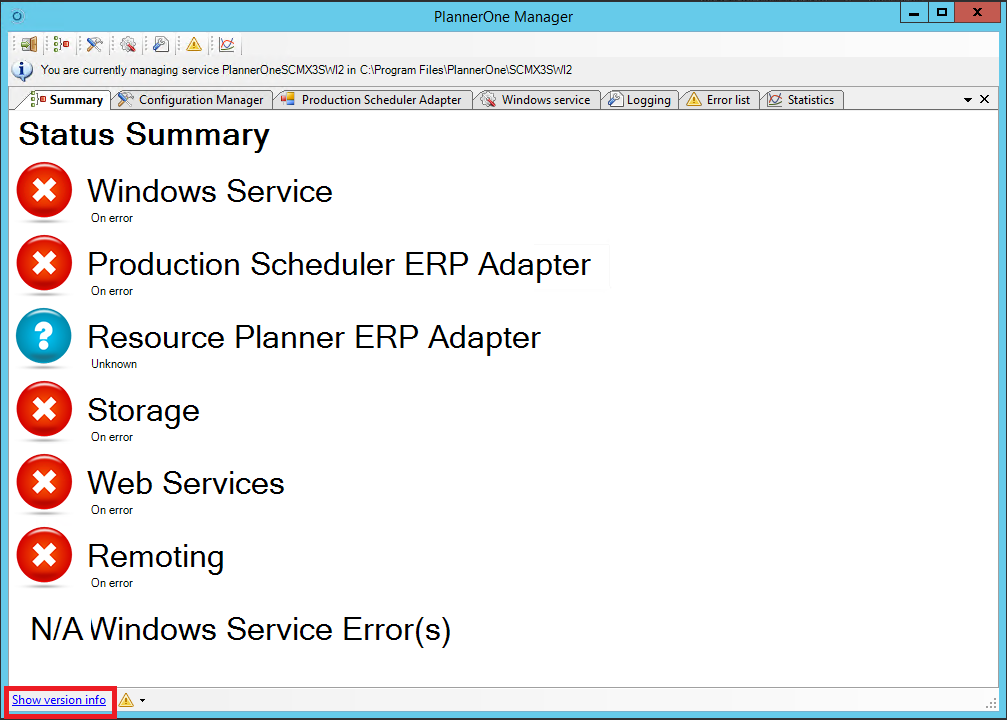
Click Show version info.
Appendix 2: How to check the current mapping version
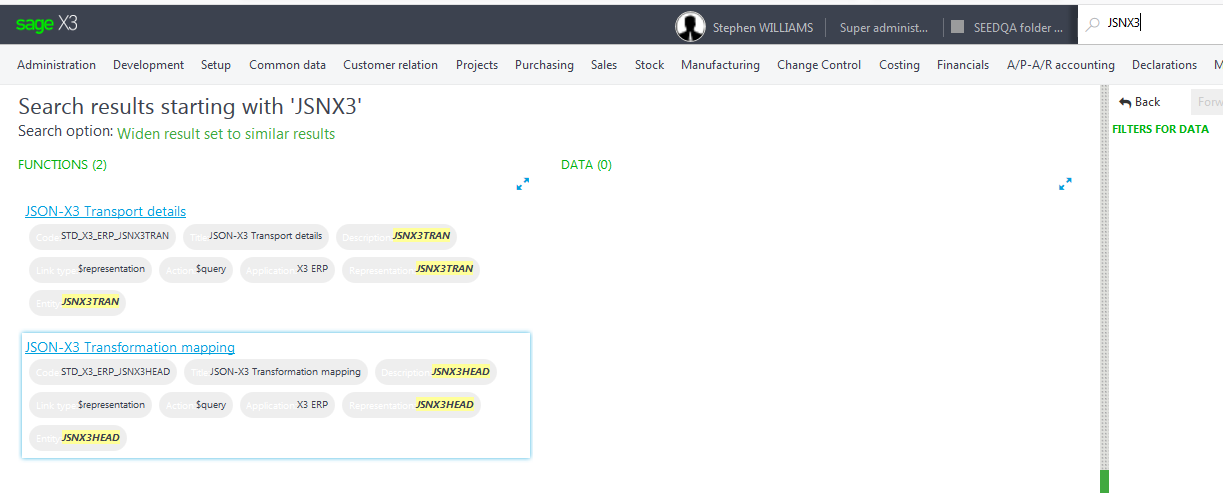
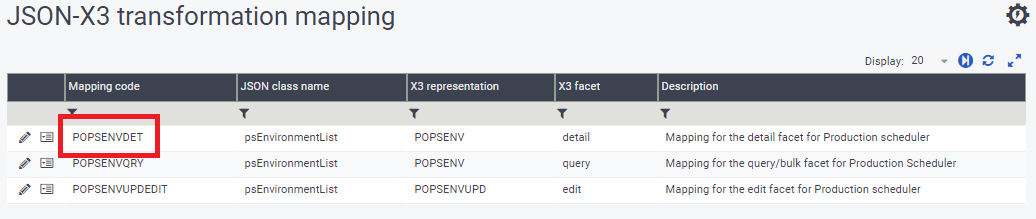
- To check the current mapping version, first perform a search for JSNX3 and choose the JSON-X3 transformation mapping function.
- Display the Mapping code specified in the table, for example POPSENVDET.
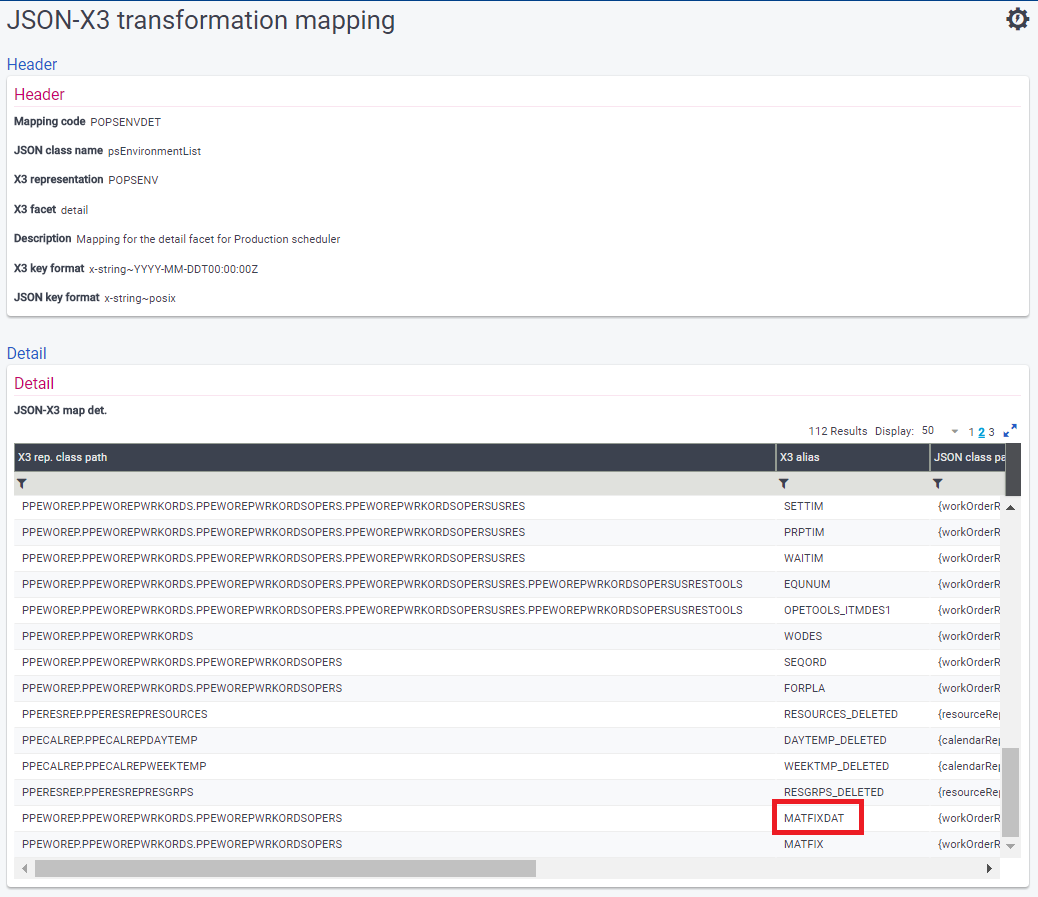
- Look for the X3 alias mentioned in the table, for example MATFIXDAT.
Appendix 3: How to change the logging level of Production Scheduler manager
The Production Scheduling logging level is set to INFO, by default. This provides a lot of information, however, sometimes more information is needed.
To change the logging level means issuing some PowerShell commands.
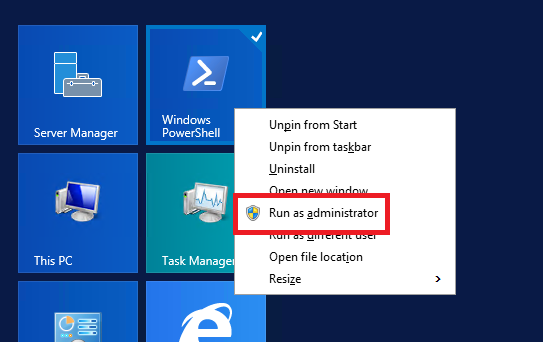
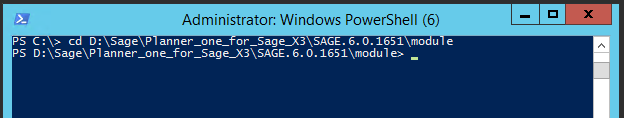
- First run a PowerShell window.
- Change directory to the Production Scheduler PowerShell directory. You can find this where Production Scheduler is installed (usually C:\Sage\Planner_one_for_Sage_X3\SAGE.6.0.xxxx\module, where xxxx is the version number).
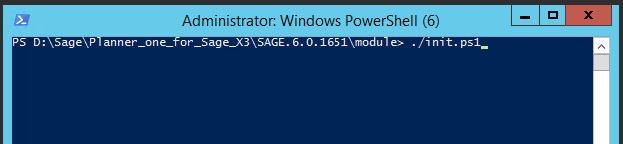
- Run the init.ps1 script.
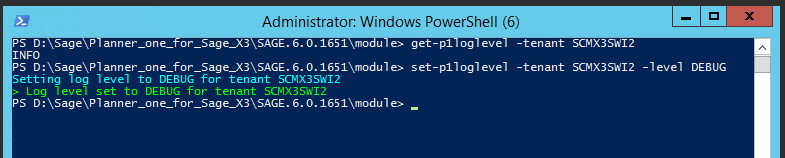
- Check the current log level.
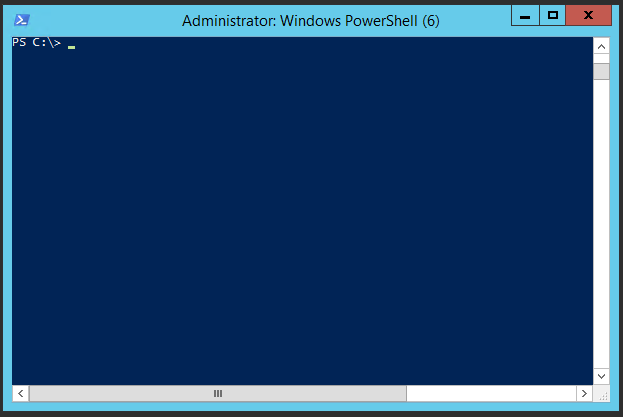
It is best to run a PowerShell window as Administrator to avoid permission problems.
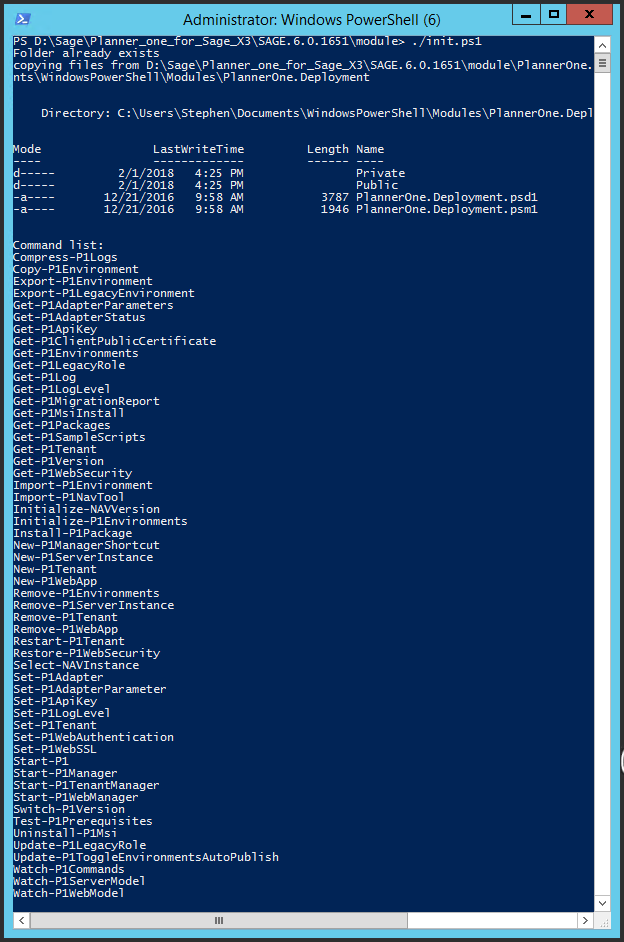
All available commands are displayed.
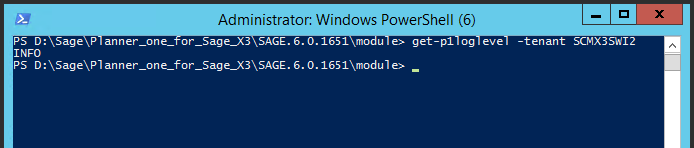
Change the logging level. The highest level is DEBUG.
Appendix 4: Using the Postman application to identify problems
Postman is a standalone application that enables bundles and web services to be accessed without having to write a program. The latest version can be downloaded from the following location: https://www.getpostman.com/.
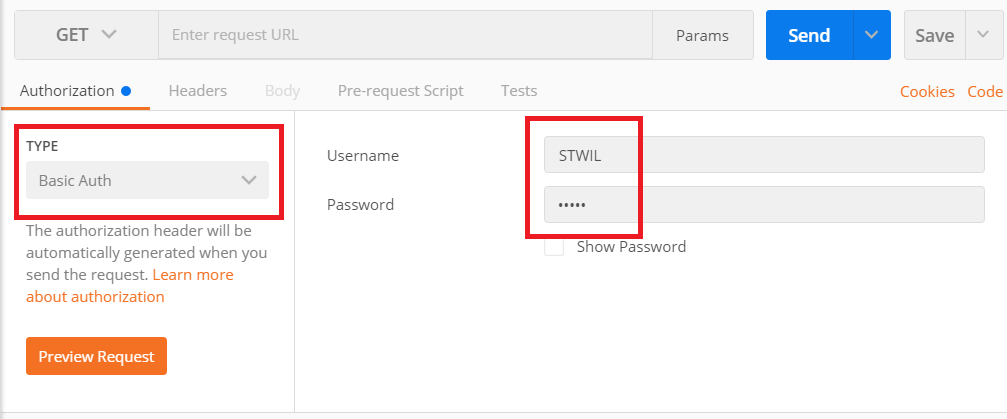
- To use Postman to identify problems set the Authorization Type to Basic Auth.
- Add the Sage X3 Username and Password.
- Enter the URL for the data request. There is a specific format for the request URL depending on the action. External and internal requests are available. The internal request gets data directly from Sage X3 without using the bundle.
- The request is sent to Sage X3 and data returned.
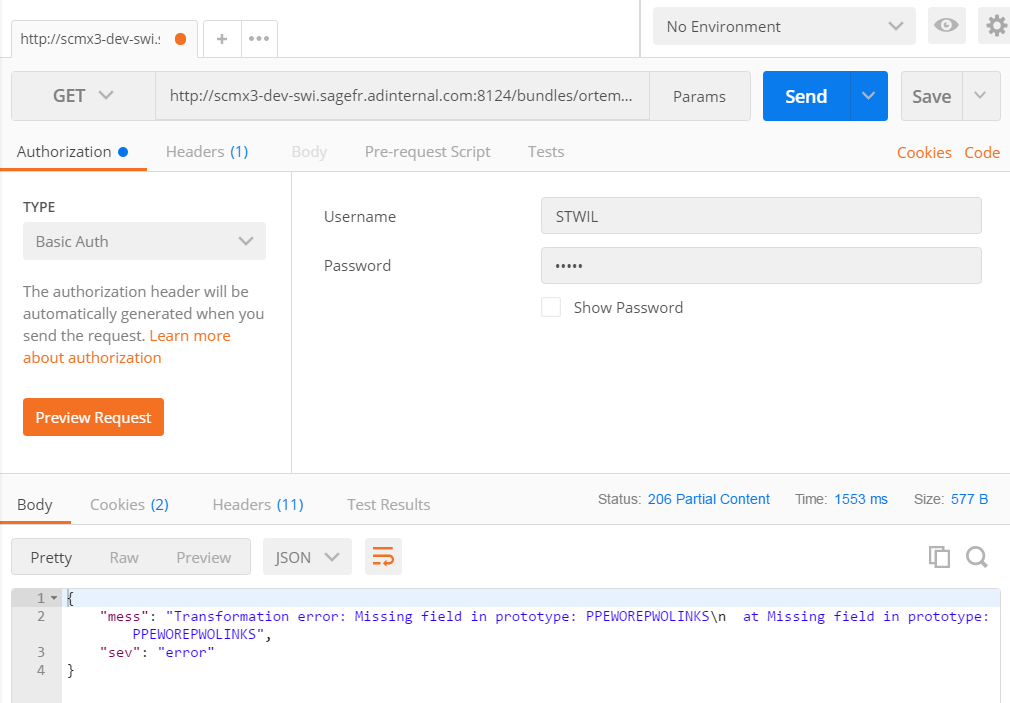
mess and sev are the elements that Production Scheduler does not recognize.
In our example we see the actual error message is a transformation error. Transformation errors suggest a mapping problem.
Variable parts of URL
The variable parts used in the URL for a data request are currently as follows:
| Variable | Part |
|---|---|
| {protocol} | http |
| {host} | Sage X3 host server |
| {port} | Port number (if used) |
| {app} | Sage X3 folder |
| {class} | Sage X3 class |
| {site} | Site code (called Environment in PlannerOne) |
| {timestamp} |
Timestamp, in posix format Only data updated after this time will be sent. |
| External variable | Part |
| {representation} | Sage X3 representation |
| nnnnn | Unique tracking ID number generated by the calling system. |
| Internal variable | Part |
| {maxrec} | Maximum number of entities per slice (as detailed in JSNX3TRAN or 0 for all). |
| {endtimstp} | Maximum timestamp used to look for records, based on first request runtime. |
| {curtab} | Table where maximum entities were exceeded. |
| {curkey} | Key where maximum entities were exceeded. |
External request types
Bulk query - to retrieve all of the sites
{protocol}://{host}:{port}/bundles/ortems/X3/erp/{app}/{class}?representation={representation}.$bulk&trackingId=nnnnn
Detail query - to retrieve all of the information for a site
{protocol}://{host}:{port}/bundles/ortems/X3/erp/{app}/{class}('{site}')?representation={representation}.$details&trackingId=nnnnn
Detail query - to retrieve all of the information for a site that has changed since the timestamp
{protocol}://{host}:{port}/bundles/ortems/X3/erp/{app}/{class}('{site}~{timestamp}')?representation={representation}.$details&trackingId=nnnnn
Edit post - send information to update in Sage X3
{protocol}://{host}:{port}/bundles/ortems/X3/erp/{app}/{class}('{site}')?representation={representation}.$edit&trackingId=nnnnn
Examples
The URL to get all data for site USA10 would be:
http://scmx3-dev-swi.sagefr.adinternal.com:8124/bundles/ortems/X3/erp/LOCALDEV/POPSENV('USA10')?representation=POPSENV.$detailsThe URL to get all data for site USA10 that changed after the datetime 02/14/2019 - 15:20:00 would be:
http://scmx3-dev-swi.sagefr.adinternal.com:8124/bundles/ortems/X3/erp/LOCALDEV/POPSENV('USA10~1550157600')?representation=POPSENV.$detailsInternal request types
Detail query - to retrieve all of the information for a site including the maximum size of data slice
{protocol}://{host}:{port}/api1/X3/erp/{app}/{class}('{site}~~{maxrec}')?representation={representation}.$details
Detail query - to retrieve all of the information for a site that has changed since the timestamp plus the maximum size of data slice
{protocol}://{host}:{port}/api1/X3/erp/{app}/{class}('{site}~{timestamp}~{maxrec}')?representation={representation}.$details
Detail query - to retrieve all of the information for a site that has changed since the timestamp with continuation information
{protocol}://{host}:{port}/api1/X3/erp/{app}/{class}('{site}~{timestamp}~{maxrec}~{endtimstp}~{curtab}~{curkey}')?representation={representation}.$details{site}- Site code (called environment in PlannerOne)
Examples
The URL to get all data for site USA10 would be:
http://scmx3-dev-swi.sagefr.adinternal.com:8124/api1/X3/erp/LOCALDEV/POPSENV('USA10')?representation=POPSENV.$detailsThe URL to get all data for site USA10 that changed after the datetime 02/14/2019 - 15:20:00 would be:
http://scmx3-dev-swi.sagefr.adinternal.com:8124/api1/X3/erp/LOCALDEV/POPSENV('USA10~2019-02-14T15:20:00Z')?representation=POPSENV.$detailsAppendix 5: Using Wireshark to retrieve publish data
Wireshark is an application that monitors network traffic. It enables us to see data being sent to and from Production Scheduler. The latest version can be downloaded from the following location: https://www.wireshark.org/.
Install Wireshark on the Production Scheduler server.
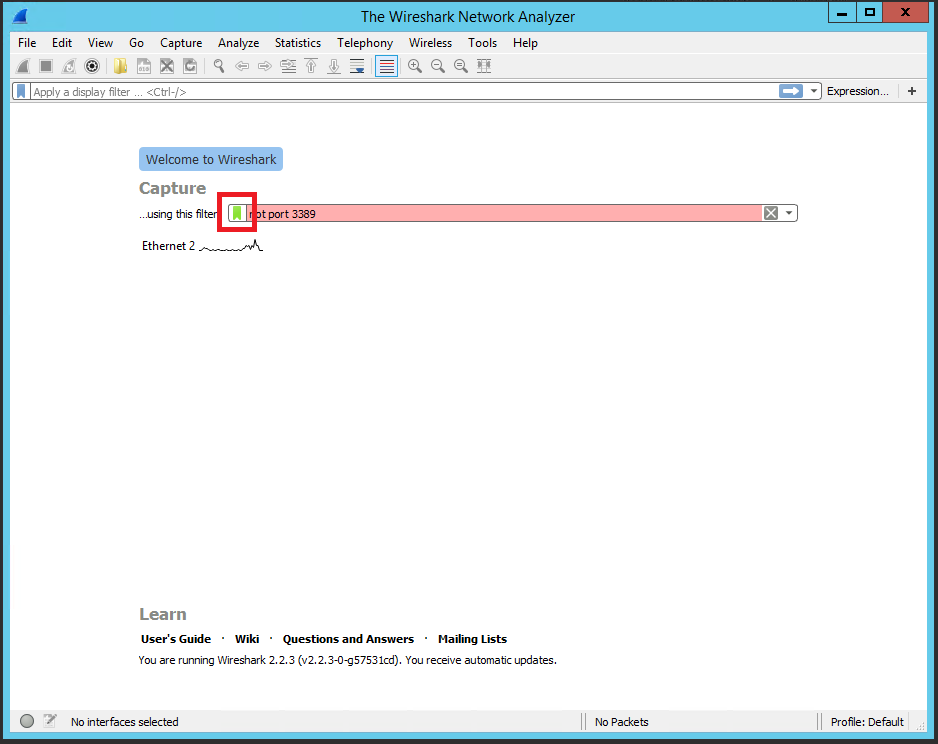
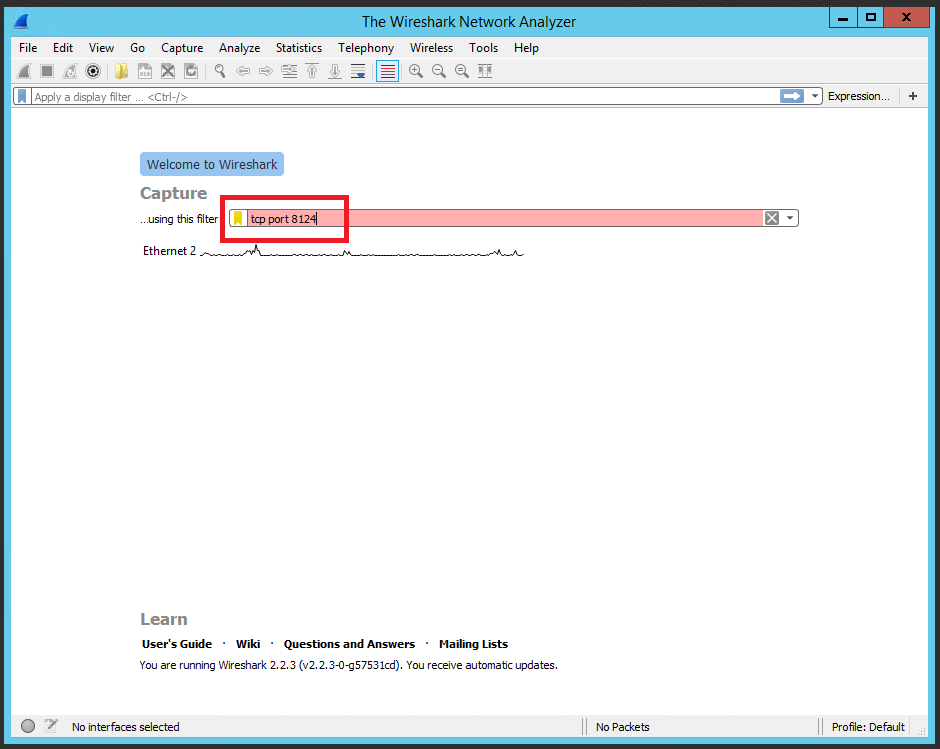
It is a good idea to enter a capture filter to only capture traffic to and from Sage X3. You can do this by filtering traffic using the Sage X3 port number. In our example this is 8124.
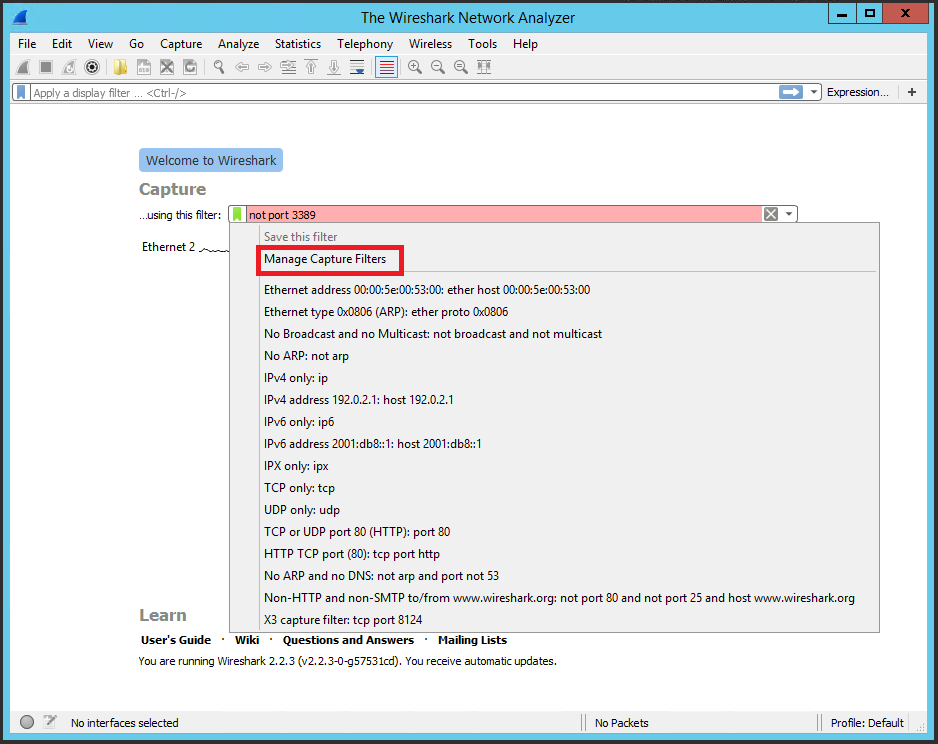
- To add a capture filter, in Wireshark click the Manage filters icon.
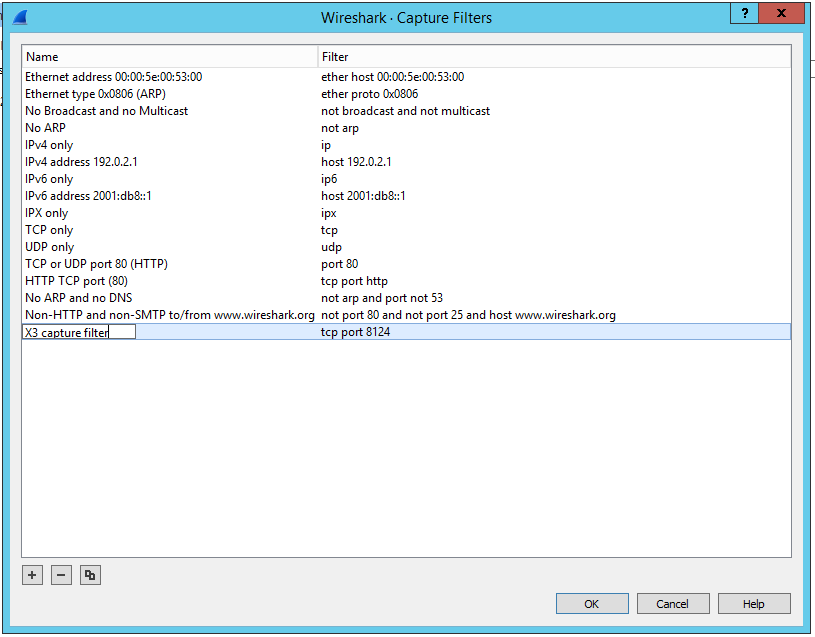
- Specify the Sage X3 port number and give it a name.
- Select this filter from the list.
- Click the network link (in our example this is Ethernet 2) to view the traffic.
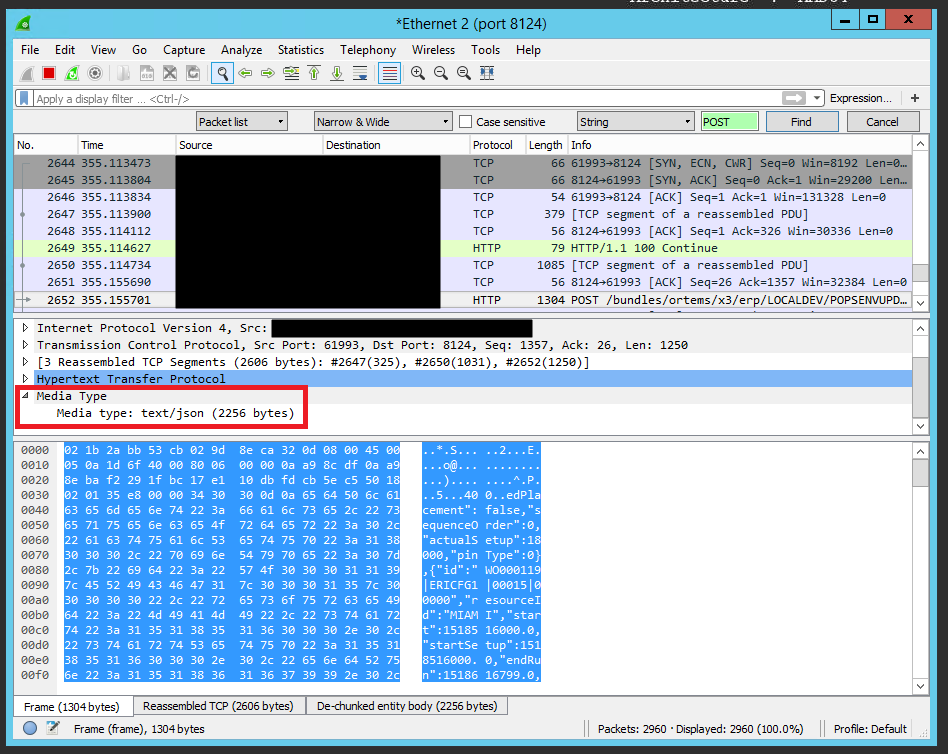
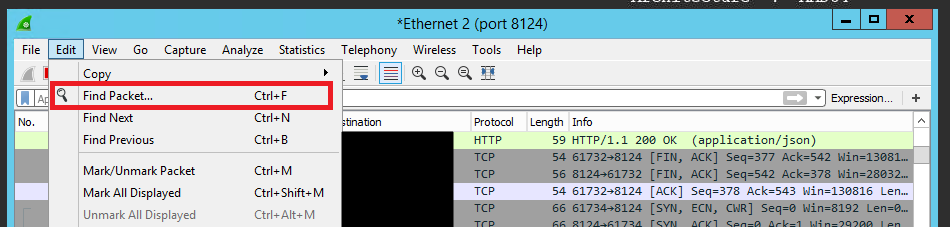
- To search for the POST requests, select the Find Packet option.
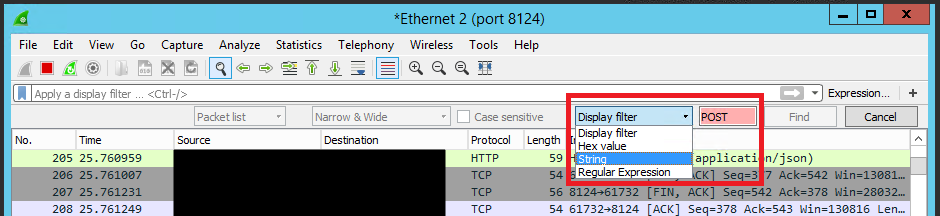
- Search for POST, specifying STRING as the Display filter type.
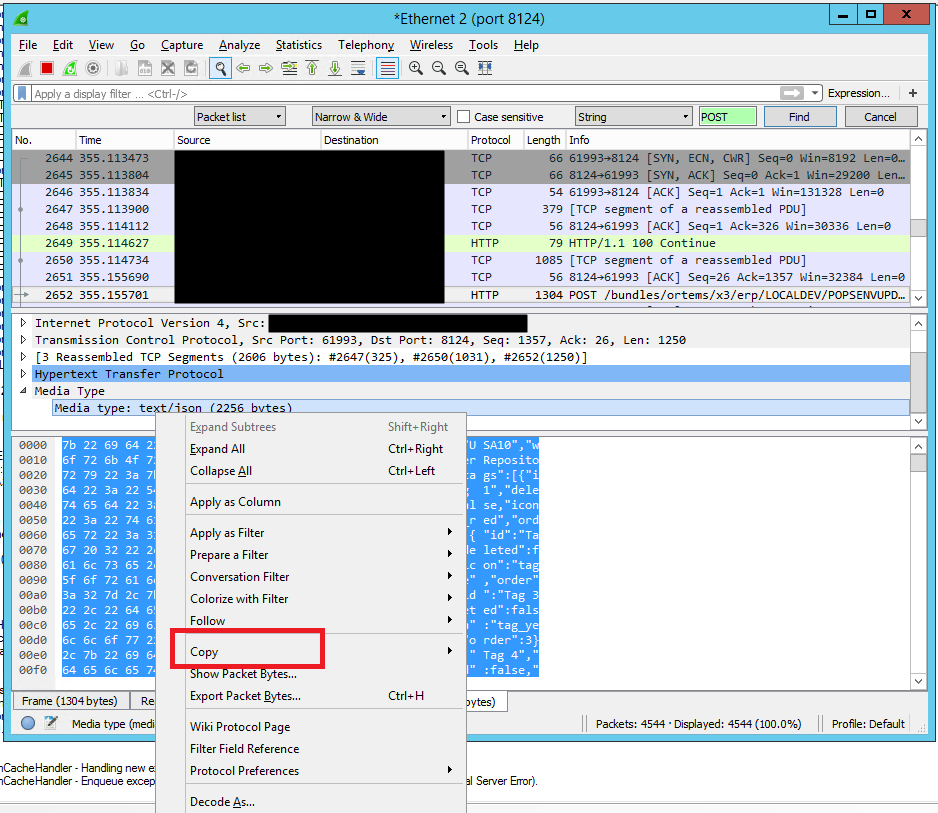
- Right-click on the Media type. Select Copy to copy the data in the request, then select As printable text.
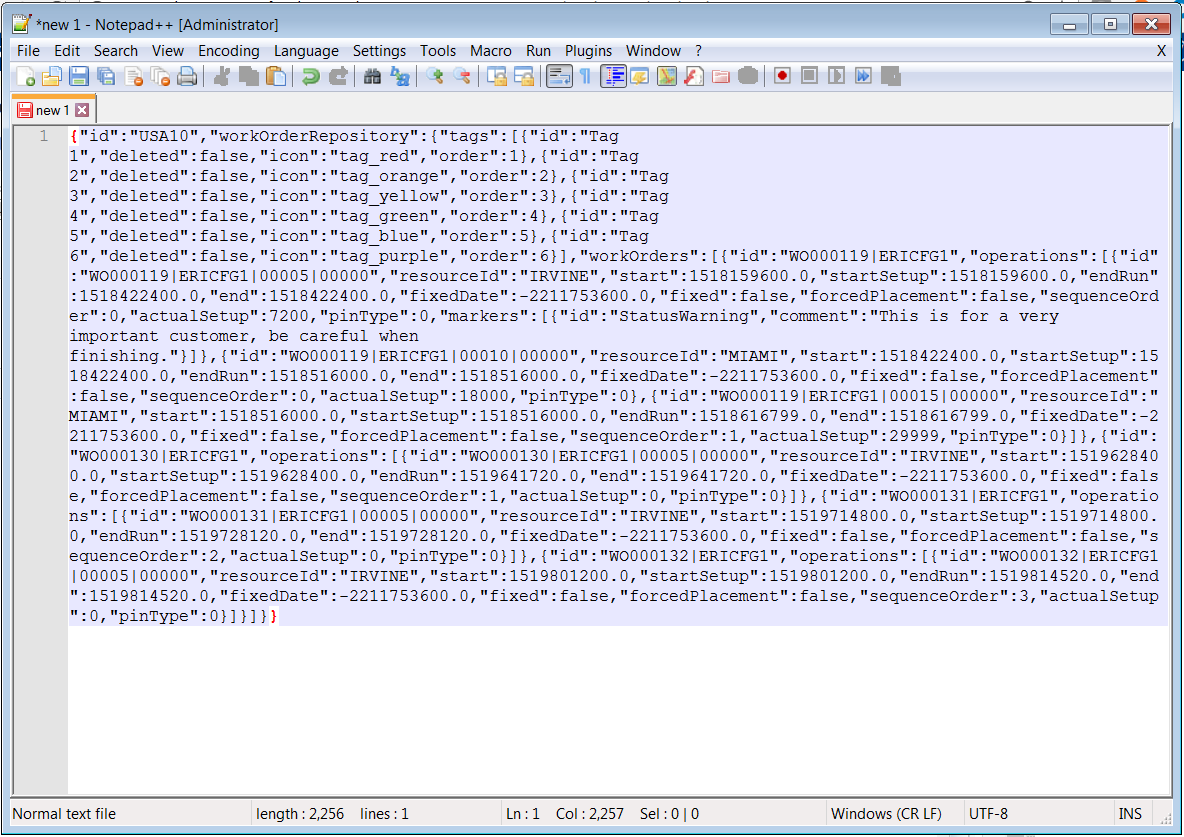
- Once you have copied the data you need to view it. We use Notepad++.
- What you see using Notepad++ is not very readable.
- We save the file as a JSON type file, then to get a more readable version, format it using a JSON viewer plugin.
This allows you to enter a new filter.
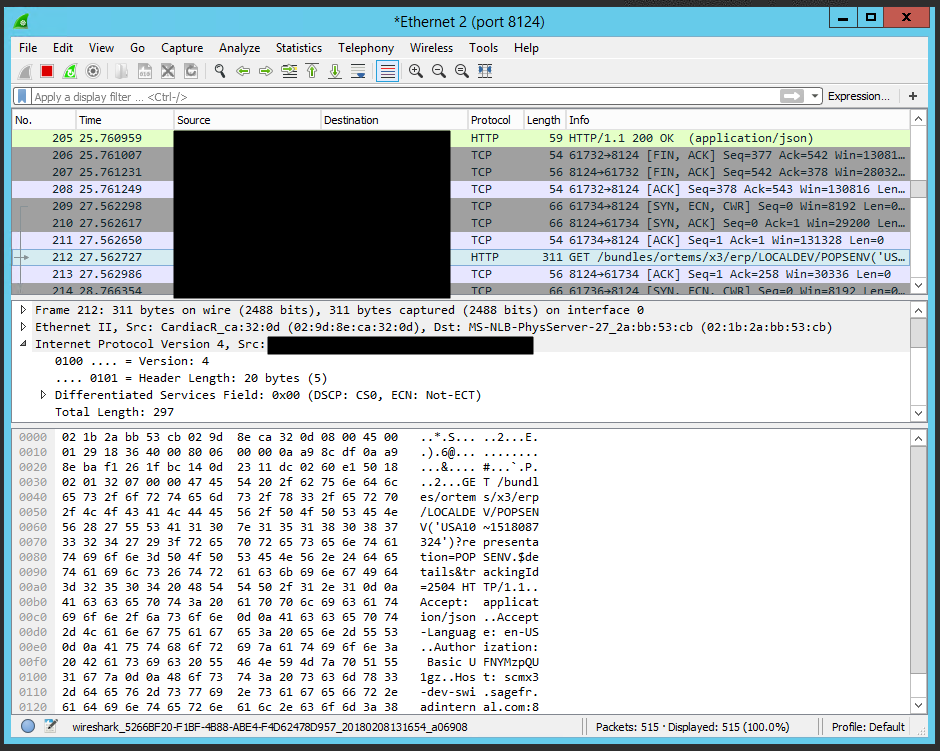
Most of the traffic will not be useful, but when we do a publish we need to look for a specific type of request - a POST request.
We are interested in the first POST request.