Appendix: Understanding the Allure Report
Overview
The Overview page displays a summary of the automated tests execution run.
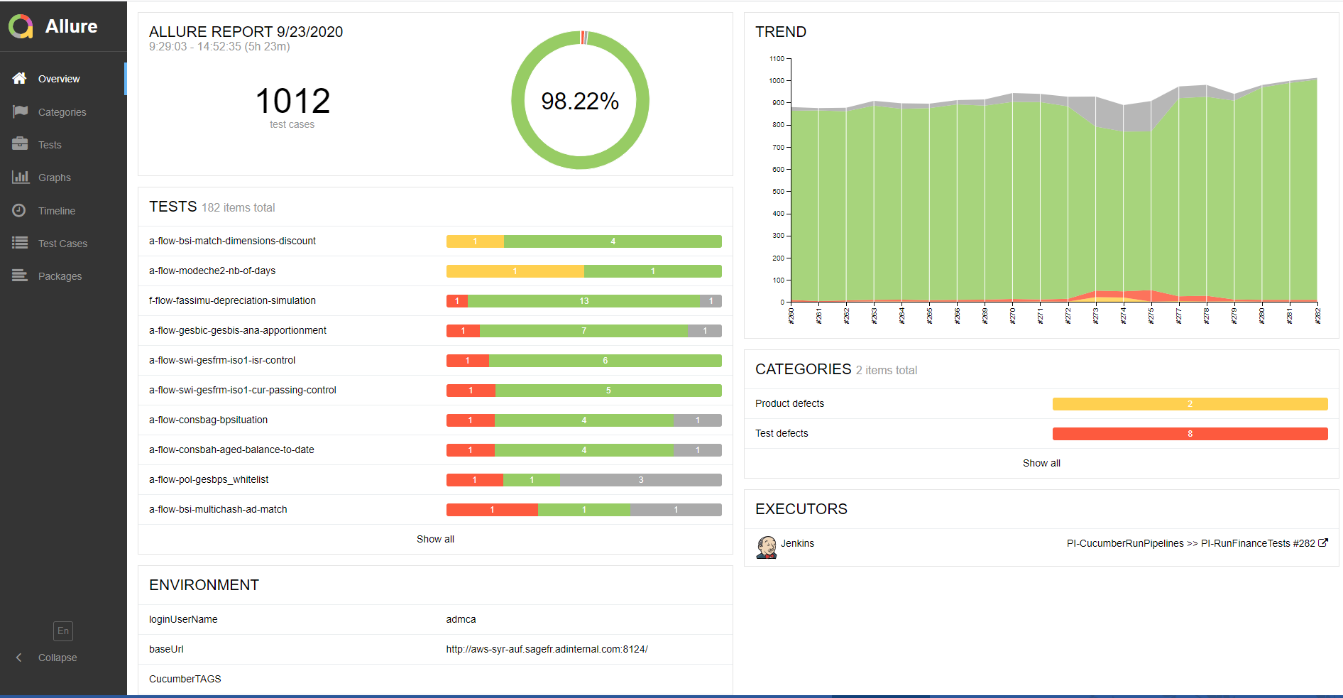
- The first block displays the overall percentage execution:
- Green - The percentage of scenarios (or tests cases) that passed.
- Red - The percentage of scenarios (or tests cases) that are broken. For example test defects.
- Yellow - The percentage of scenarios (or tests cases) that failed. For example, product defects (expected tests values different from actual ones, Error messages returned by the application).
- Grey - The percentage of scenario (or tests cases) skipped. This corresponds to the percentage of scenarios that have not been executed because the previous scenario failed.
- The TESTS block displays an extract of the tests (or features) that have been executed.
- The ENVIRONMENT block displays the environment parameters used for the execution.
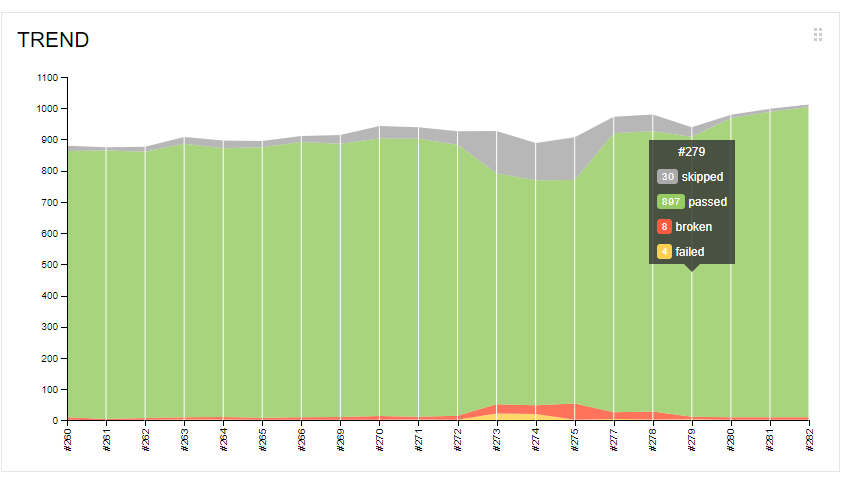
- The TREND block displays the execution trend.
- Click a specific build to open the corresponding Allure Report.
- Hover the mouse over a specific build to view the number of tests at each status.
- The CATEGORIES block displays an extract of each category that failed execution.
To view all tests, click Show all. Alternatively, click Tests in the menu.
For example, which user executed the test and on which environment.
You can:
To view all categories that failed execution, click Show all. Alternatively, click Categories in the menu.
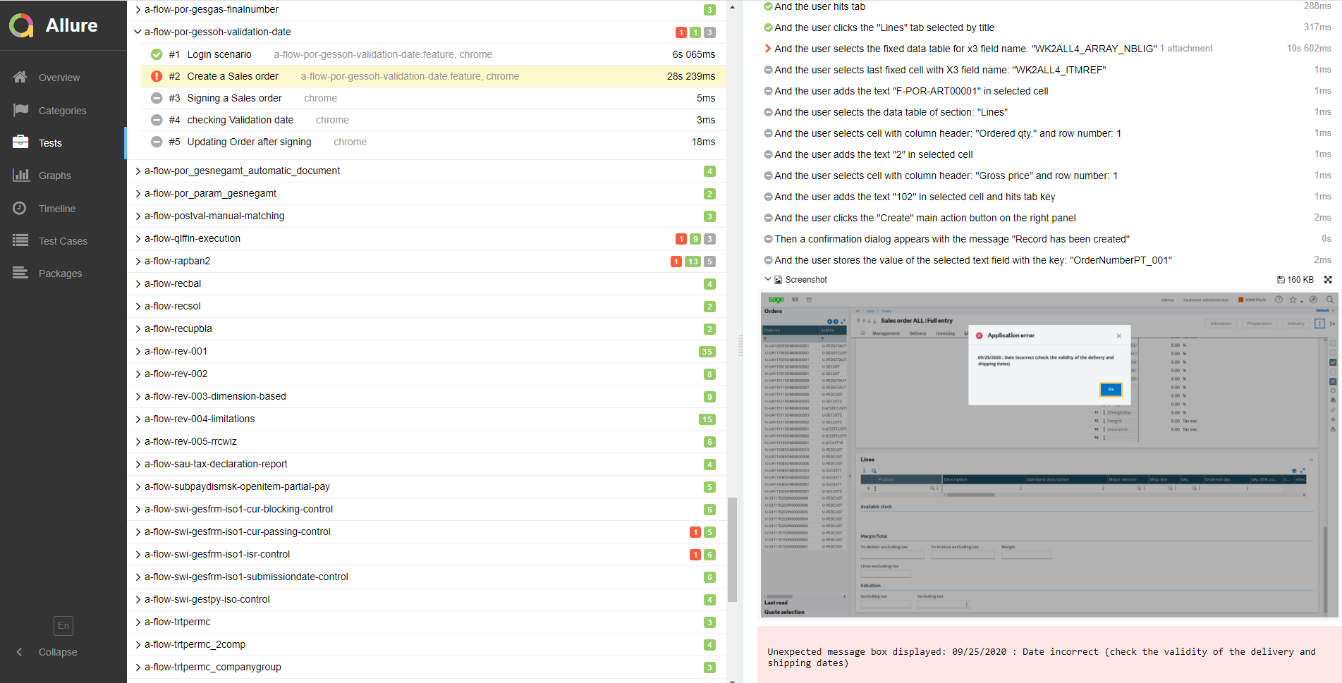
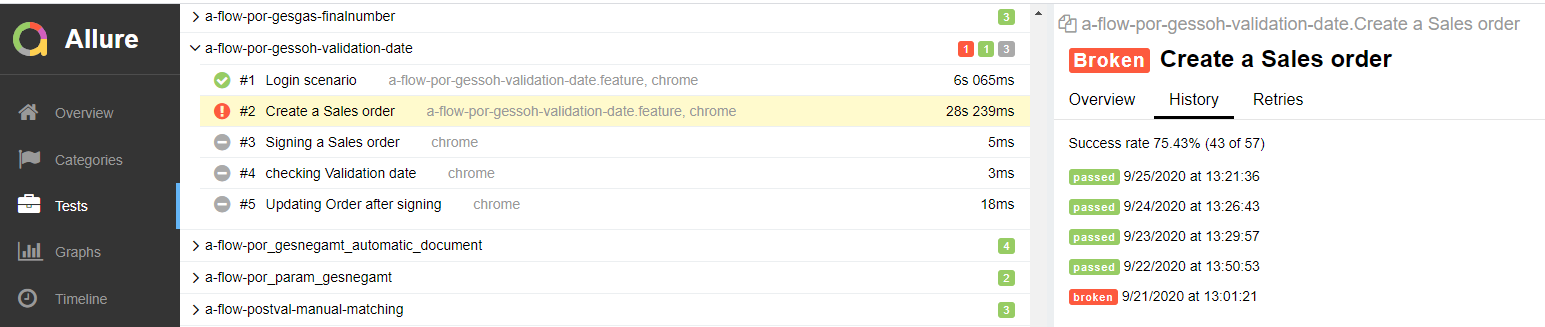
Tests
The Tests page displays a list of the automated tests (or features) that have been executed.
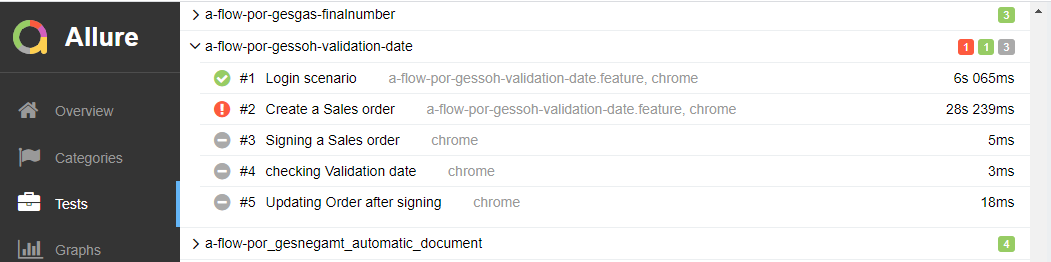
- Each feature displays the total number of steps (or actions) in the feature that were executed:
- Green - The total scenarios (or tests cases) that passed.
- Red - The total scenarios (or tests cases) that are broken. For example test defects.
- Yellow - The total scenarios (or tests cases) that failed. For example, product defects (expected tests values different from actual ones, Error messages returned by the application).
- Grey - The total scenarios that have been skipped. This corresponds to the total of scenarios that have not been executed because the previous scenario failed.
- Click a specific feature to view the individual scenarios that were executed.
- Click a specific scenario:
- The individual step definitions that were executed are displayed:
- A History tab is displayed from which you can switch to a different Allure Report.
Icon Result

The step definition passed without error. 
The step definition failed. Click the step definition to expand it. The screenshot taken when the error occurred on Sage X3 is displayed.

The step definition was skipped because the previous step definition failed. - The individual step definitions that were executed are displayed:
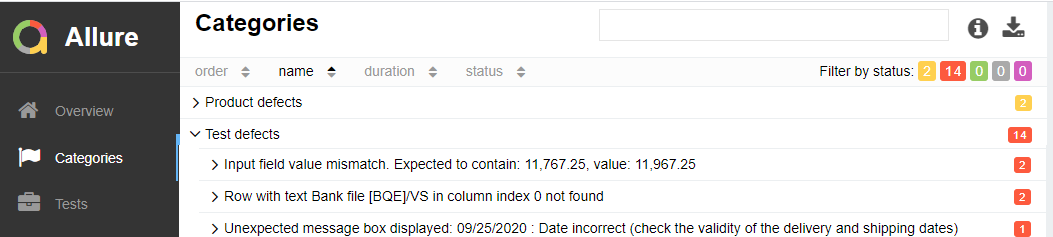
Categories
The Categories page displays a list of the scenarios that failed execution, by category.
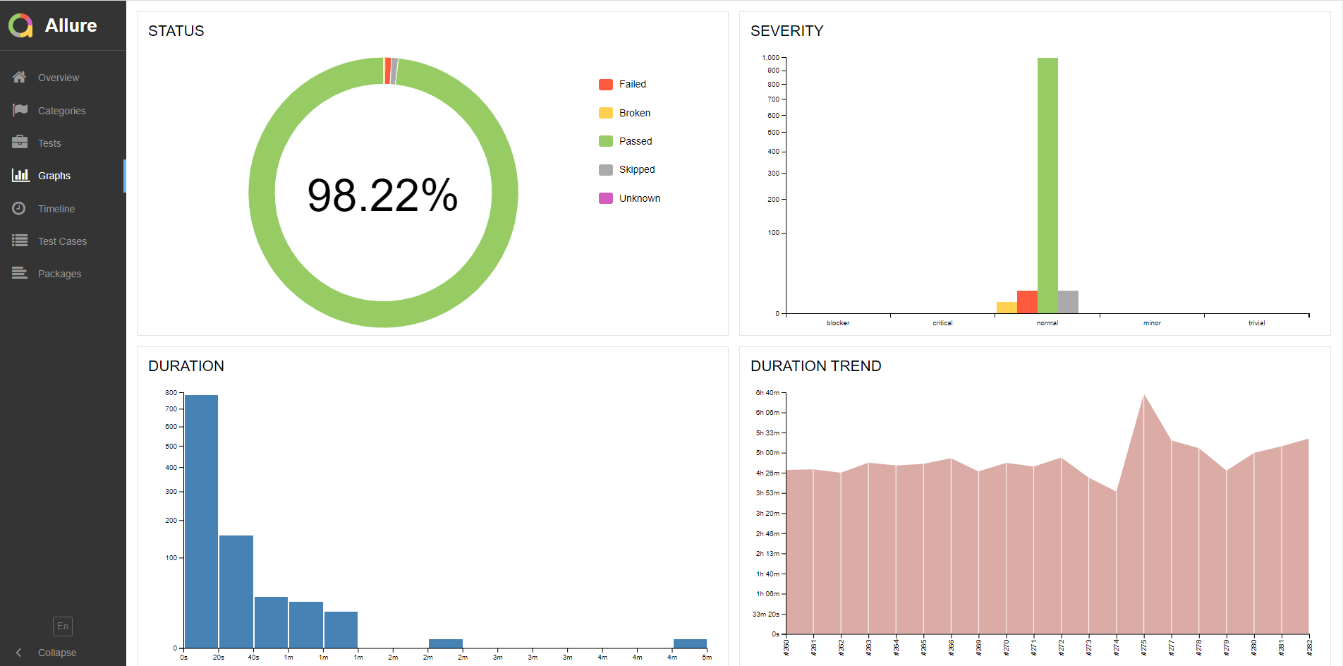
Graphs
The Graphs page displays graphs generated by the Allure Report.
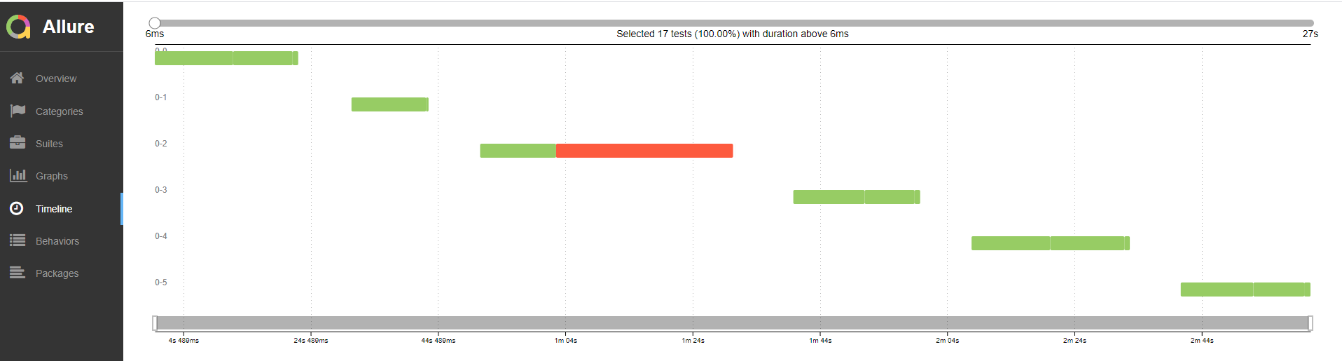
Timeline
The Timeline page displays the order in which the scenarios were executed.