Working with Allure
After you have executed your automated tests, you can generate or archive an Allure report. What displays in the Allure report depends on how the test was executed.
-
If you run the automated tests in debug mode, the Allure report shows the latest test executed.
-
If you run multiple tests simultaneously, the report shows all the automated tests that were executed during the last run.
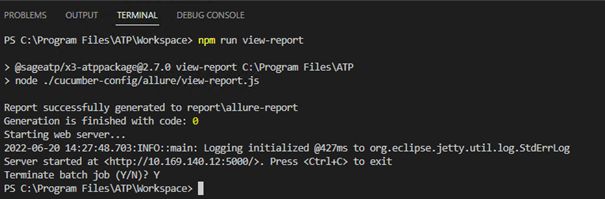
Displaying results
-
Make sure no other processes are running.
-
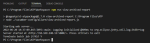
Enter the .\atp view-report command in the VS Code terminal and then press Enter. To stop the command, press Ctrl+C and enter the required answer to confirm your choice.
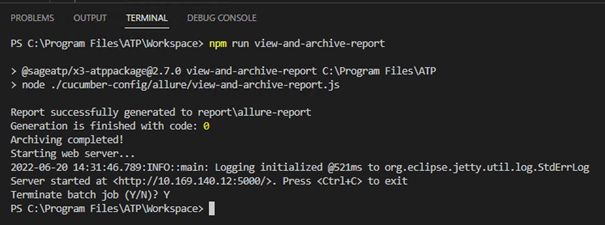
Archiving and displaying a report web page
This command allows you to archive the last Allure report generated during the execution.
-
Make sure no other process is running, (e.g., the .\atp view-report command).
-
Enter the .\atp view-and-archive-report command in the VS Code terminal and then press Enter. To stop the command, press Ctrl+C and enter the required answer to confirm your choice.
-
To open an Allure report, just click the Allure report numerical reference.
-
To stop the command press Ctrl+C in the terminal.
Displaying the archived report web page
This command allows you to display the archived report web page.
-
Make sure no other process is running, (e.g., the .\atp view-report command).
-
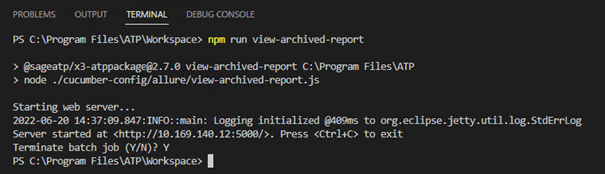
Enter the following command in the VS Code terminal .\atp view-archived-report and then press Enter.
To open an Allure report, just click on the Allure report numerical reference.
To stop the command press Ctrl+C in the terminal and enter the required answer to confirm your choice.
Understanding Allure reports
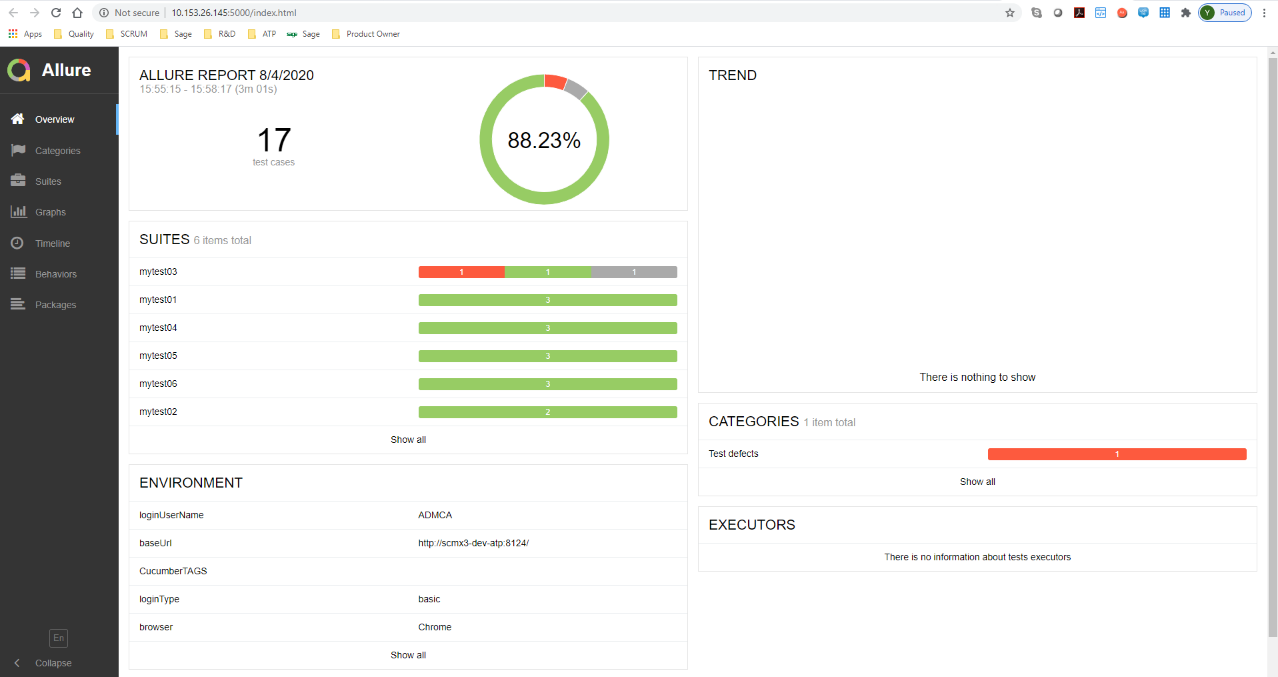
The first page of the Allure report shows the automated test summary.
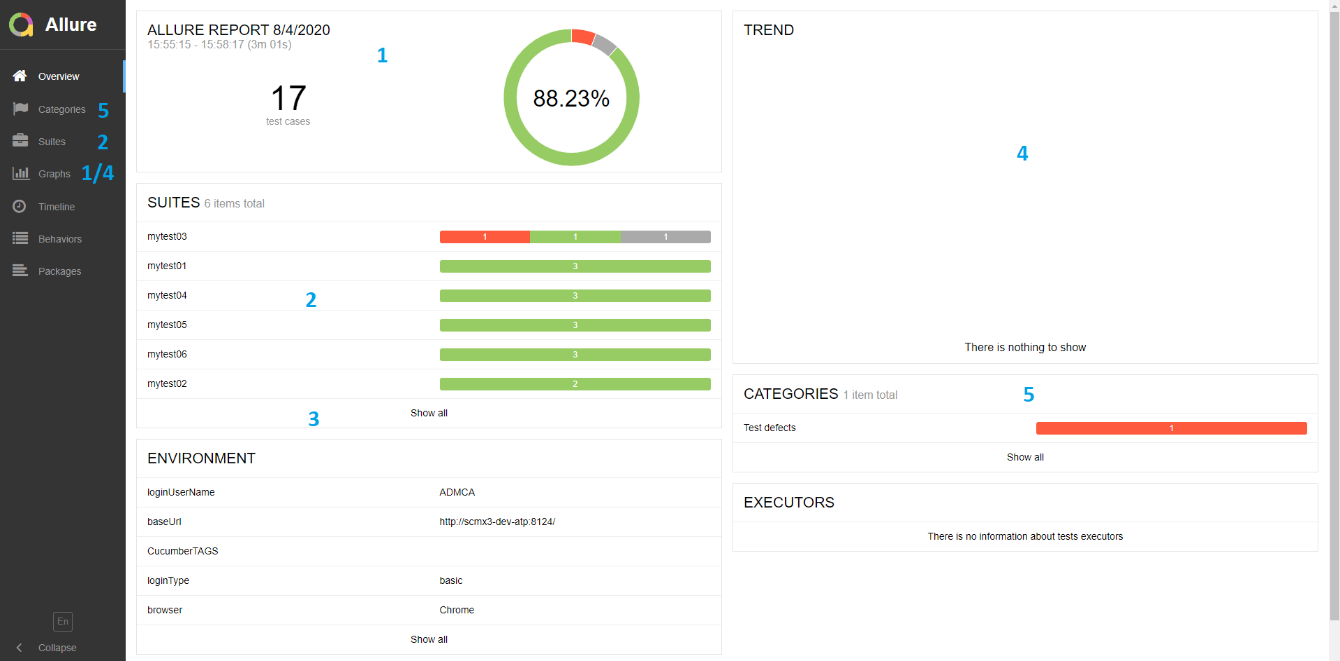
The first block shows the overall percentage.
-
In green, the percentage of scenarios (or tests cases) that passed.
-
In red, the percentage of scenarios (or tests cases) that are broken. For examples test defects.
-
In yellow, the percentage of scenarios (or tests cases) that failed. For example, product defects such as values different from the expected ones, unexpected message box returned by the application.
-
In grey, the percentage of scenarios (or tests cases) skipped. This corresponds to a scenario that was not executed because the previous scenario failed.
The second block shows an extract of the tests (or feature) that were executed.
To see all, you can click Show all or Suites.
The third block shows the list of the environment parameters such which user was used on a specific environment.
The fourth block displays the Trend execution.
When automated tests are executed from VS Code, neither the Trend nor the historical data (previous execution) displays. This feature is only possible when the automated tests are executed via Jenkins.
The fifth block shows an extract of the Categories. Categories are used to regroup failed scenarios by error type.
To show all the categories, you can click Show all or Categories.
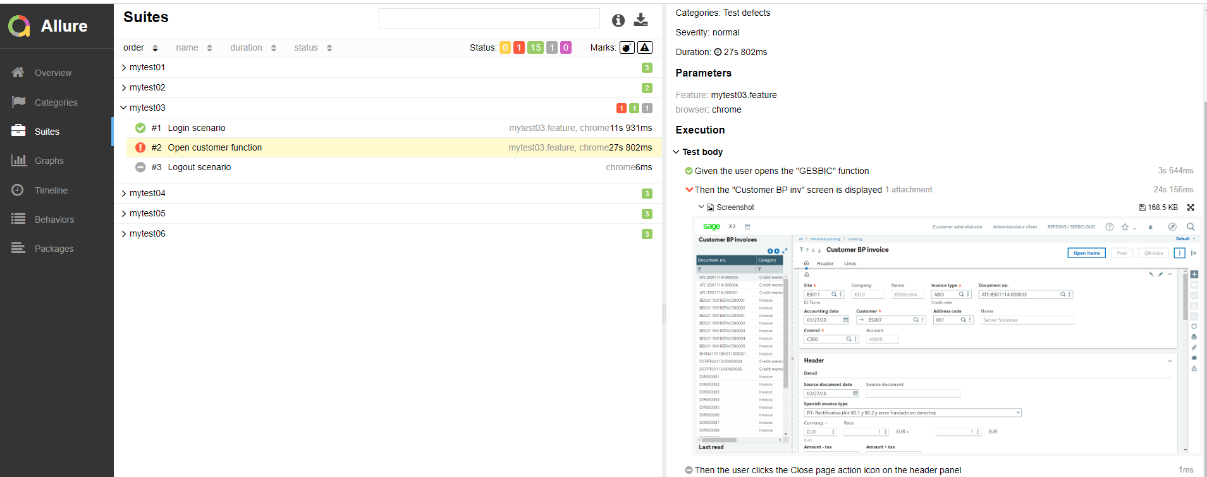
Suites
This section shows the list of the automated tests (features) that were executed.
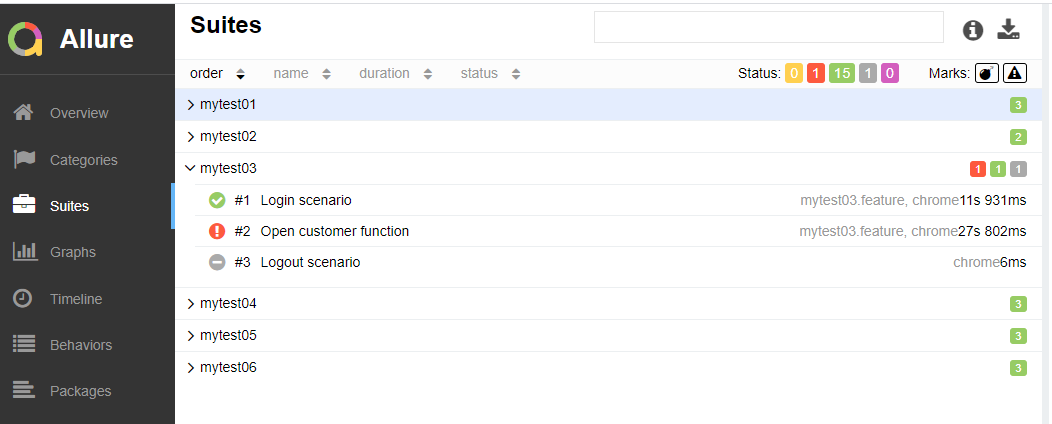
Each feature shows the different scenarios for the feature that was executed.
-
In green, the scenario (or tests cases) that passed.
-
In red, the scenario (or tests cases) that broke.
-
In yellow, the scenario (or tests cases) that failed.
-
In grey, the scenarios that were skipped because the previous scenario failed.
When you display the scenario details, the different step definitions (or actions) executed display.
|
|
Step definitions with no errors. |
|
|
Step definitions that failed. Expand to see a screenshot. |
|
|
Step definitions that were skipped because the previous step failed. |


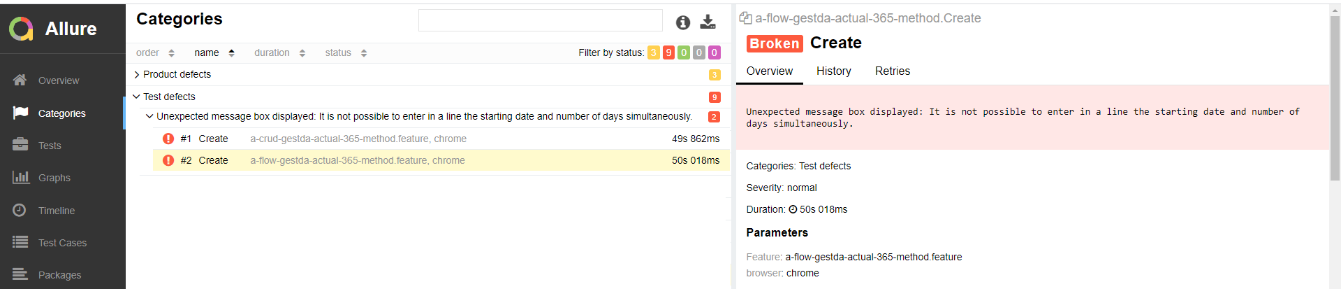
Categories
This section displays the scenarios that failed by category. It facilitates your ability to analyze results by revealing a pattern of errors.
Graphs
This section displays graphs generated by the Allure report.
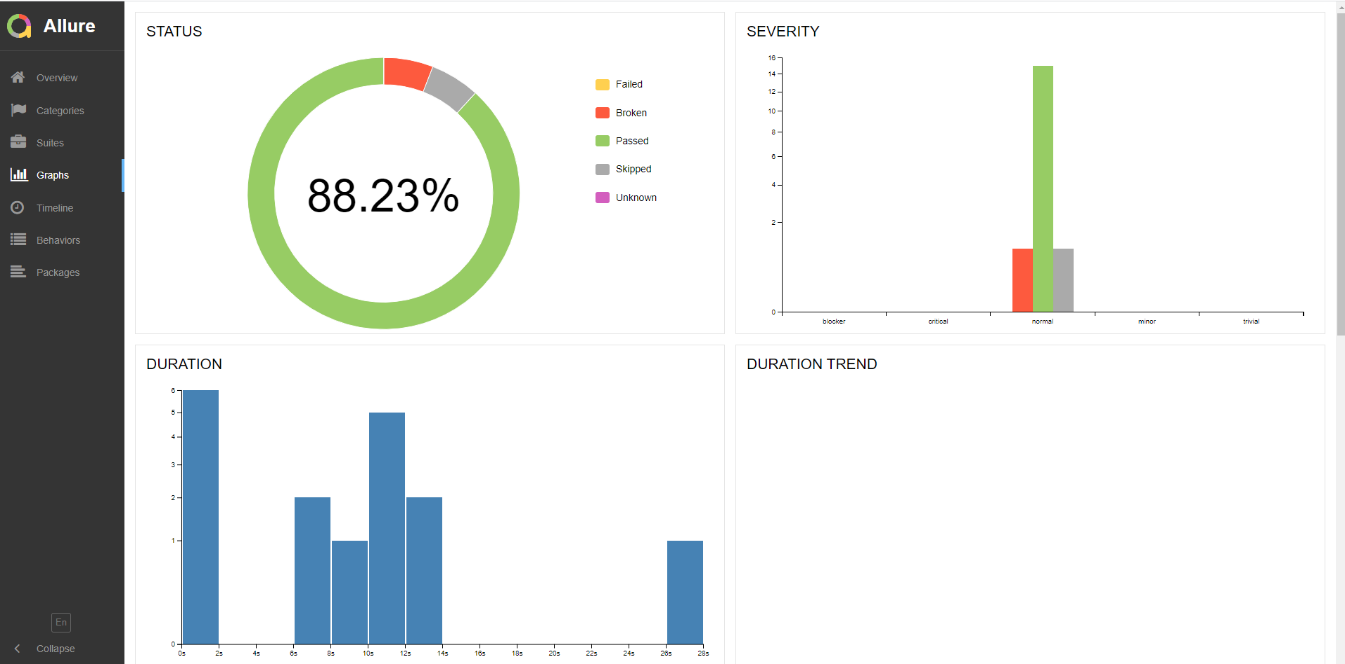
When automated tests are executed from VS Code, neither the Trend nor the historical data (previous execution) display. This feature is only possible when the automated tests are executed via Jenkins.
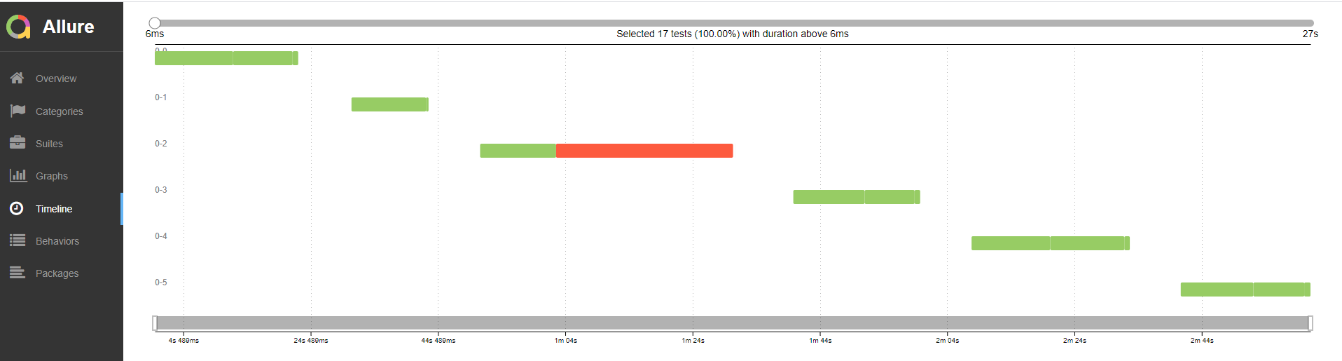
Timeline
This section shows the scenario order execution. It can help you understand in which order the scenario was executed. When possible, you will be able to see which scenarios were executed in parallel.
Allure report attachment
With Sage X3 Automation Test Platform version 3.3.0, allure report displays in attachment the code and the value of the (user) stored values calculated dynamically, as well as the value of the static parameters used during the test execution.
(user) store value attachment:
Static parameter attachment:
Printing allure report in pdf format
This functionality allows to generate Allure report in pdf format.
Printing allure report
-
Once your test has been executed.
-
Type the following command in the terminal to display the allure report: .\atp view-report
-
If the allure report is properly displayed, terminate the command by doing a
CTRL +C. -
Type the following command in the terminal:
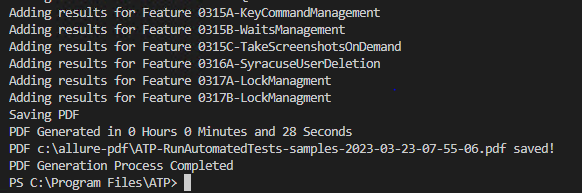
.\atp allure-pdf-print
-
A pdf report is printed with the name defined in allurePdfName parameter and in the path defined in allurePdfPath parameter.
-
The name of report generated, contains the date and time of the report generation.
Content of allure pdf document
The allure pdf generated contains the following information:
-
The signature box
-
The signature box displays:
-
The Version of Sage X3 Automated Test Platform.
-
The date of the tests execution.
-
Some information to sign the report and to leave some comments.
-
-

-
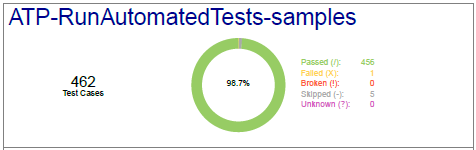
The Overall status: shows the number of scenario and success rate.
-
The following information summarize the number of tests for each status. You can use the following characters (/), (X), (!), (-), (?) to search the step definitions that passe, fail etc within the pdf document.
-
-
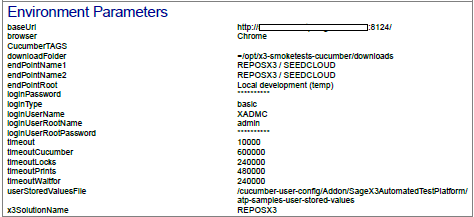
The Environment parameters list the different static parameters used during the execution.
-
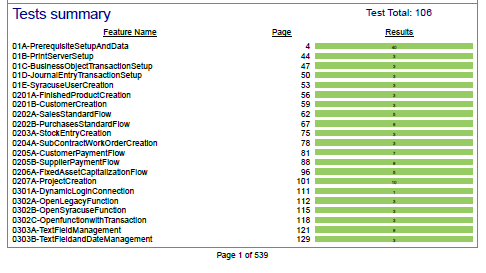
The Tests summary: lists the features executed and their different status.
-
Click the page number to navigate directly to the feature detail.
-
This section corresponds to the “Tests” section in allure report.
-
-
The tests detail: details the different features and scenarios with
-
The step definitions executed with their related status and timing information.
-
The screenshot taken on demand or when an error has occurred during the execution.
-
The error message caught by the Robot.
-
-
Limitations: The following information from allure report are not included in the pdf report:
-
Categories sections
-
Graphs
-
Timelines
-
Tests cases
-
Packages
-